Greenhouse Gas
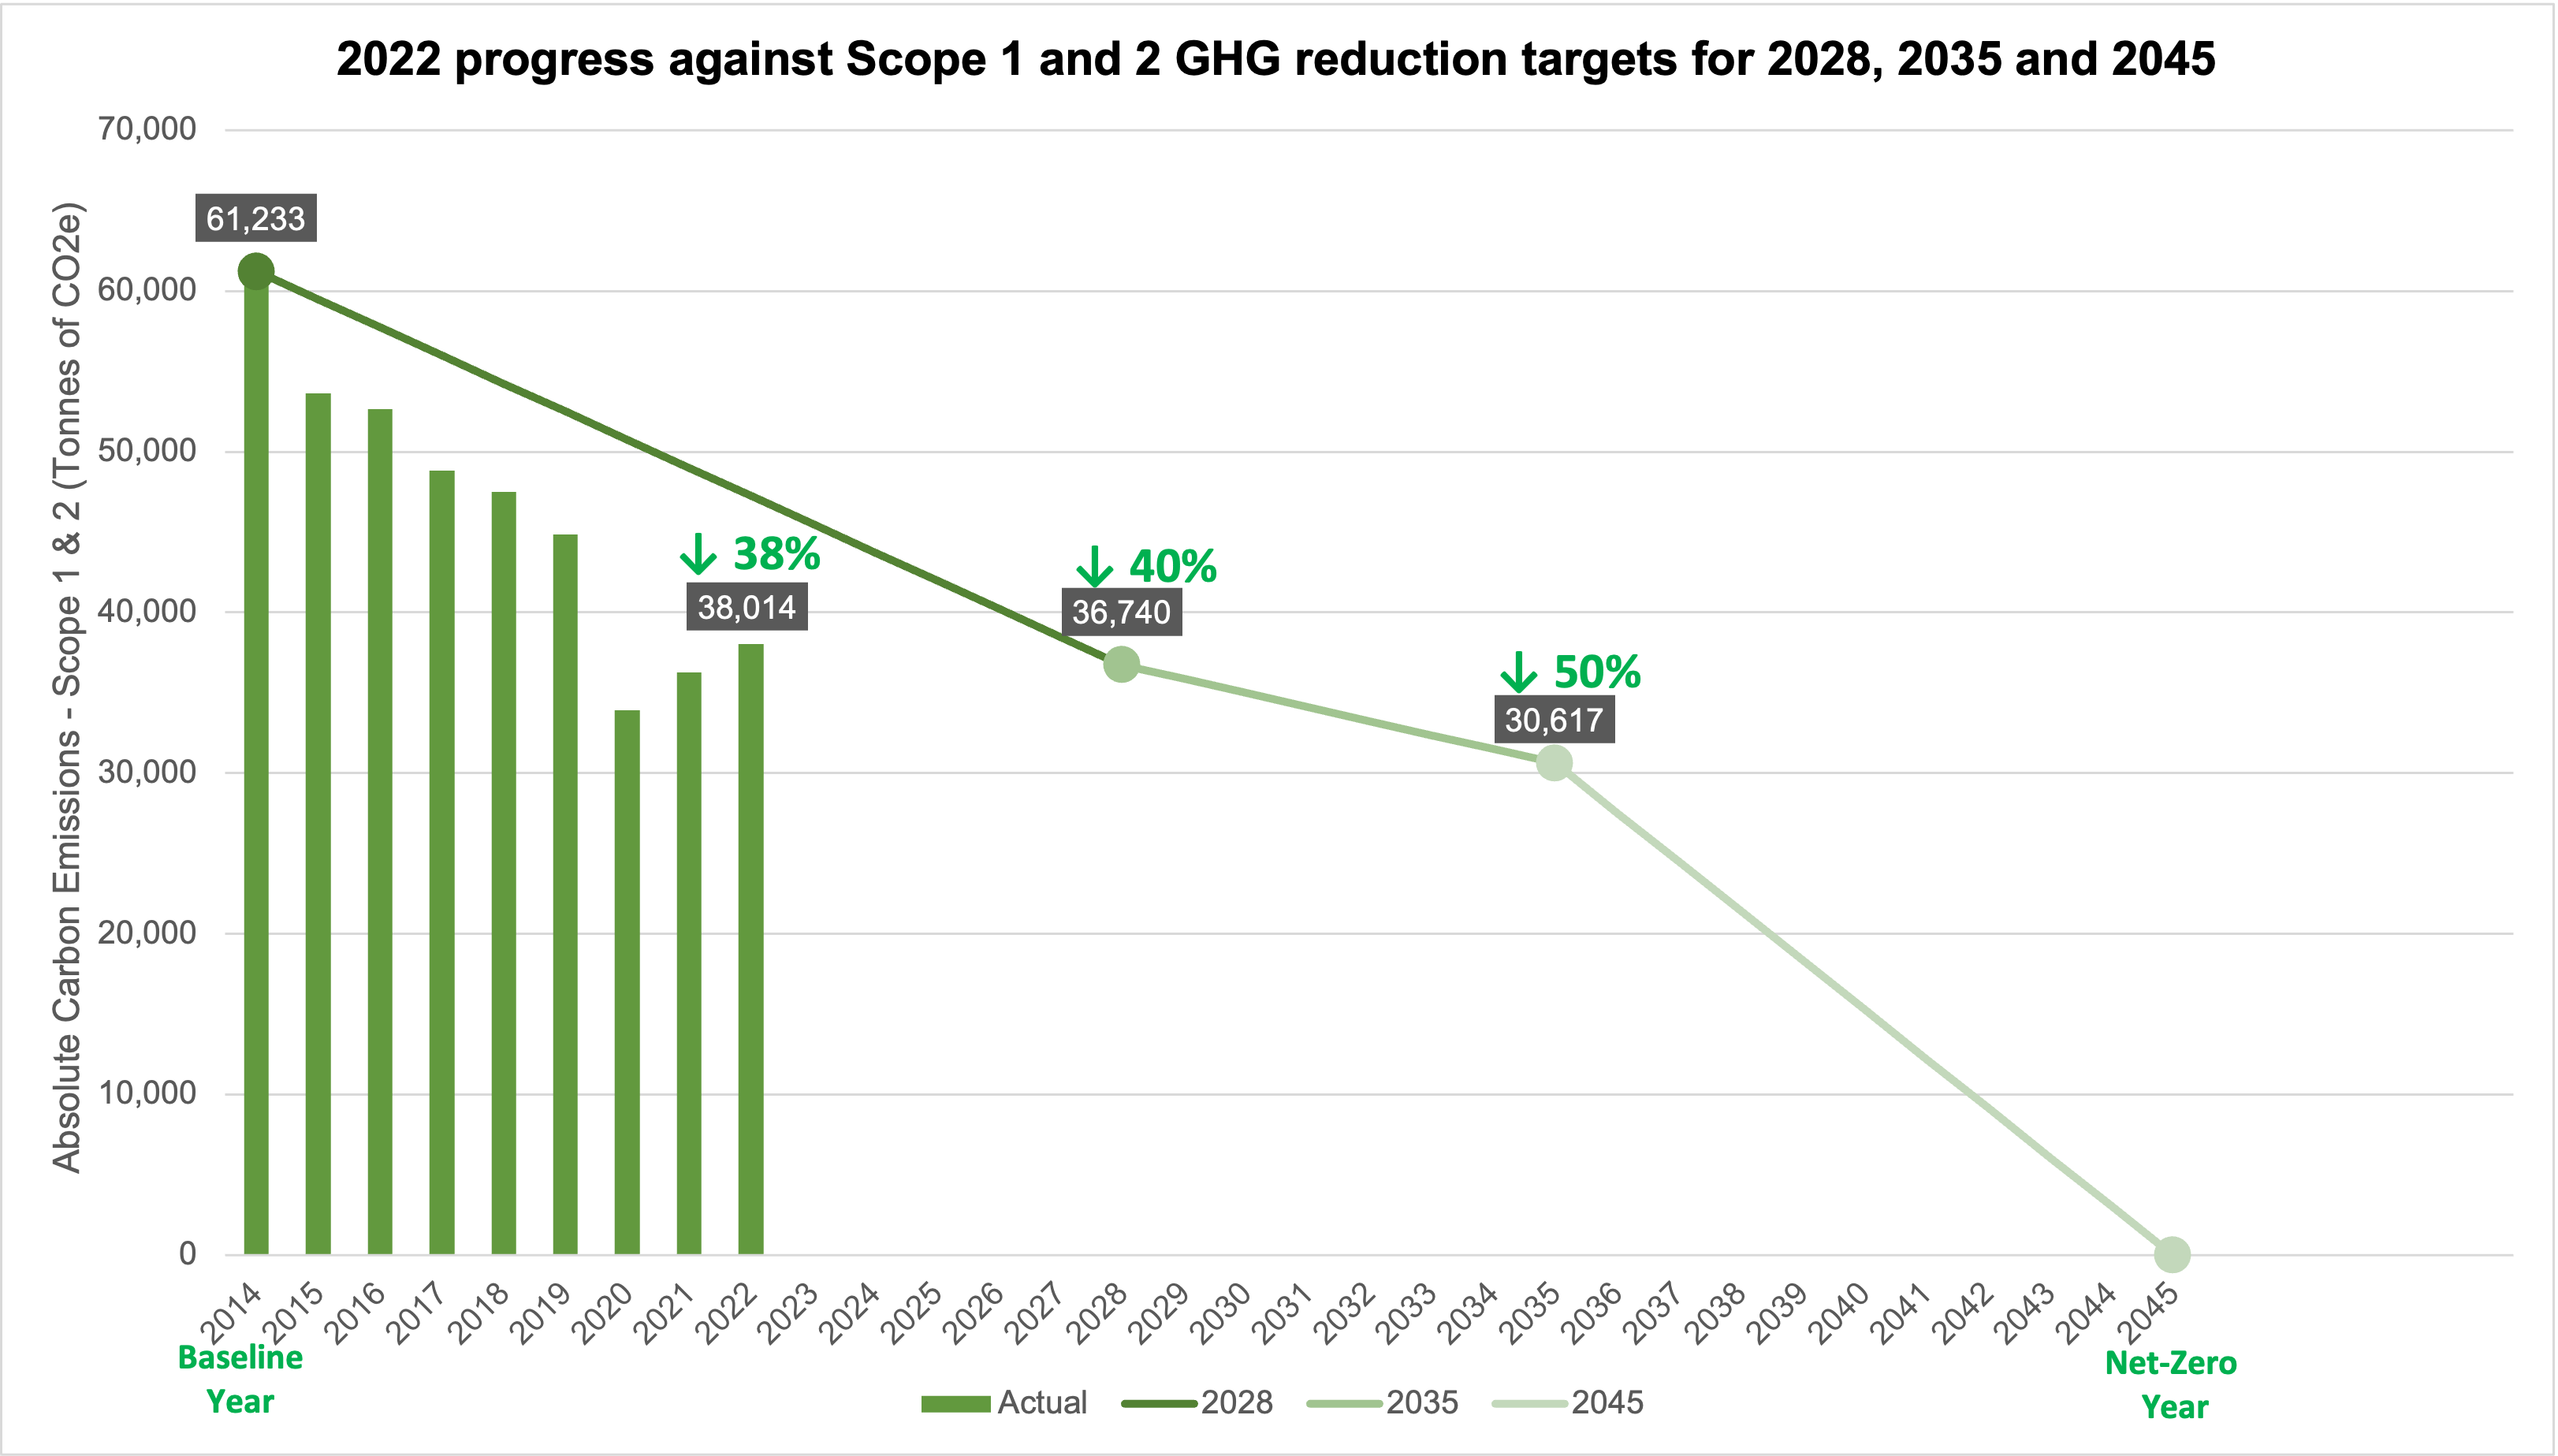
HKUST is committed to becoming a net-zero carbon university by 2045, if not earlier, by taking the lead on developing solutions that demonstrate our dedication to creating a true net-zero world. This includes scope 1 and 2 emissions and embodied carbon of the new development. For our near-term target, our target is to achieve a 40% reduction in GHG emissions (Scope 1 and 2) by 2028, using 2014 as the baseline year, as part of the HKUST 2028 Sustainability Challenge. Another near-term target is to achieve 50% reduction from the baseline year by 2035. In summary, our reduction targets for Scope 1 and 2 GHG emissions are 40% by 2028, 50% by 2035 and to achieve net-zero by 2045.
The graph below maps out our current performance against these targets. With a reduction of 38%, the rate of reduction outperforms our near term 2028 and 2035 targets.
Our reporting methodologies and emission factors follow the GHG Protocol Corporate Account and Reporting Standard, and the EPD Guidelines to Account for and Report on Greenhouse Gas Emissions and Removals for Buildings (Commercial, Residential or Institutional Purposes) in Hong Kong.
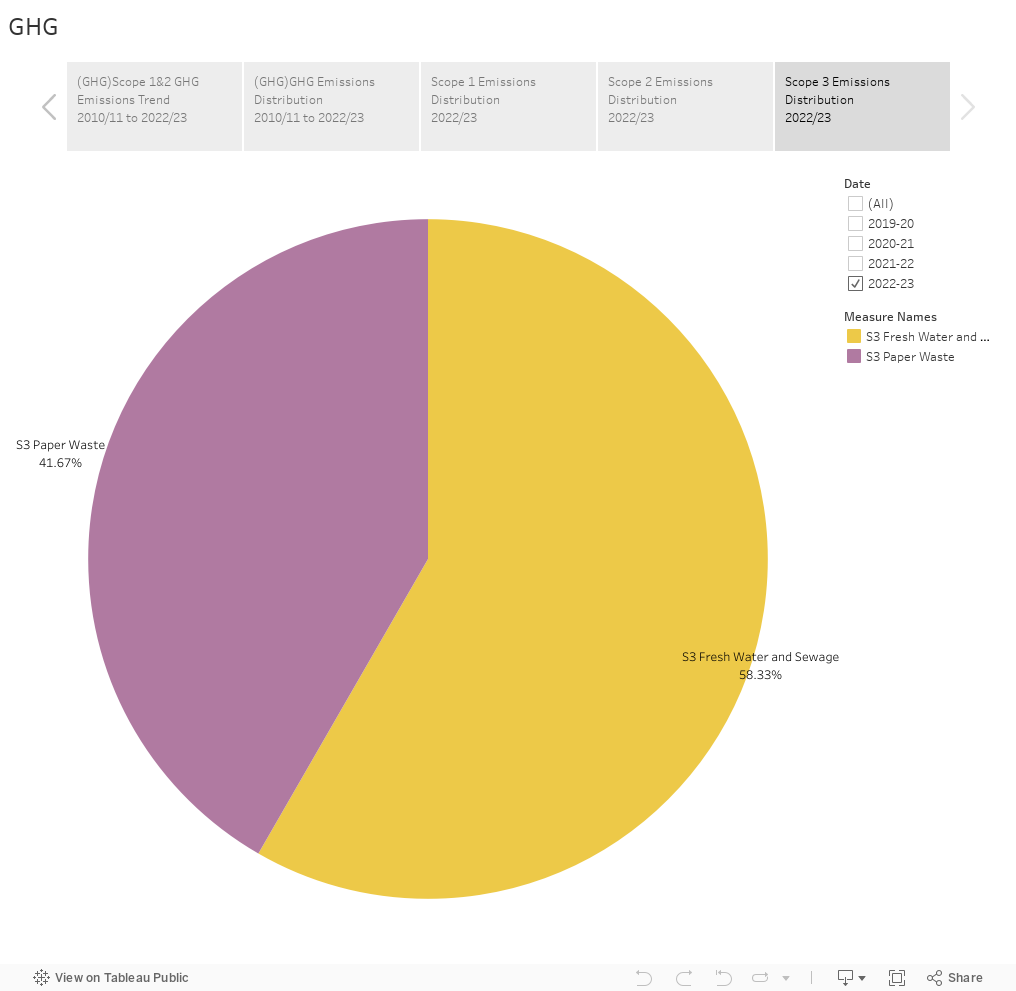
In the 2022-23 academic year, where in-person activities resumed, HKUST emitted 1,143 tonnes of CO2 equivalent (CO2e) from sources of scope 1, 36,871 tonnes of CO2e from scope 2, and 556 tonnes of CO2e from scope 3.
Compared to 2021-22 (Covid-19 pandemic period), scopes 1, 2 and 3 are 9%, 5% and 115% higher than 2021-22 respectively. The total scope 1 and 2 GHG emissions saw an overall 5% increase from 2021-22. This is attributed to the resumption of in-person activities post-covid.
Compared to the base year of 2014-15, HKUST emitted 1,405 metric tonnes of CO2e from sources of scope 1, 59,828 tonnes of CO2e from scope 2, and 795 tonnes of CO2e from scope 3. This year’s figures have decreased by 19%, 38% and 30% respectively compared to baseline year, The total scope 1 and 2 GHG emissions see an overall 38% reduction from baseline year.
GHG emission per capita is 2, and GHG emission per GFA is 0.7. Compared to 2021-22, GHG emission per capita and per GFA increased by 0.2% and 5% respectively. Compared to baseline year, GHG emission per capita and per GFA decreased by 53% and 49% respectively.
Our current progress demonstrates that there has been improvement in energy use efficiency from the infrastructure upgrade and GHG emissions factors from local utility’s greener fuel mix.
Definitions
Scope 1 emissions refer to those generated on site. Examples are gasoline for vehicles, towngas for cooking, and leaked refrigerants from air conditioning.
Scope 2 emissions refer to those generated by off-site power plants. While the university is responsible for using electricity, it has no control over the conditions in the plant.
Scope 3 emissions refer to emissions emitted by other parties, but are influenced by university actions. Examples are employee commuting and university-sponsored air travel.